← Back to portfolio

Philippine CPI Dashboard

Tracing inflation from the national headline figure to the commodities, regions, and global forces behind it.

Summary

A clearer view of what moves prices.

This dashboard presents a comprehensive analysis of the Philippine Consumer Price Index (CPI) from 2018 to 2026, built on official data from the Philippine Statistics Authority (PSA). Across five report pages, it tracks national inflation trends, breaks down price movements by commodity group and region, and identifies the specific categories driving headline inflation through weighted contribution analysis. The final page extends the analysis further, using regression modeling to quantify the relationship between global Brent crude oil prices and Philippine inflation — both nationally and across individual commodity categories — revealing a clear transmission pattern from fuel costs through transport, utilities, and food distribution. The underlying data pipeline was built on a custom SQLite star schema, with all measures validated against PSA's published figures to ensure accuracy throughout.

The question

Problem Statement

Inflation is often reported as a single national percentage, but that number obscures where price pressure is actually coming from and who it affects most. Consumers, policymakers, and businesses need to know more than "prices rose 6.2% this month" — they need to know which goods and services are driving that figure, whether some regions are experiencing sharper price increases than others, and what external forces, like global oil prices, might be fueling the trend. This dashboard addresses that gap by decomposing the Philippines' headline CPI into its underlying components: commodity-level price movements, regional disparities, and the weighted contribution of each category to overall inflation. It further tests a specific, common explanation for inflation shocks — rising global oil prices — by statistically measuring how much of the Philippines' recent inflation can actually be attributed to oil, and how that effect ripples through transport, utilities, and food costs rather than staying confined to fuel purchases alone.

Inside the report

Page Features

Overview

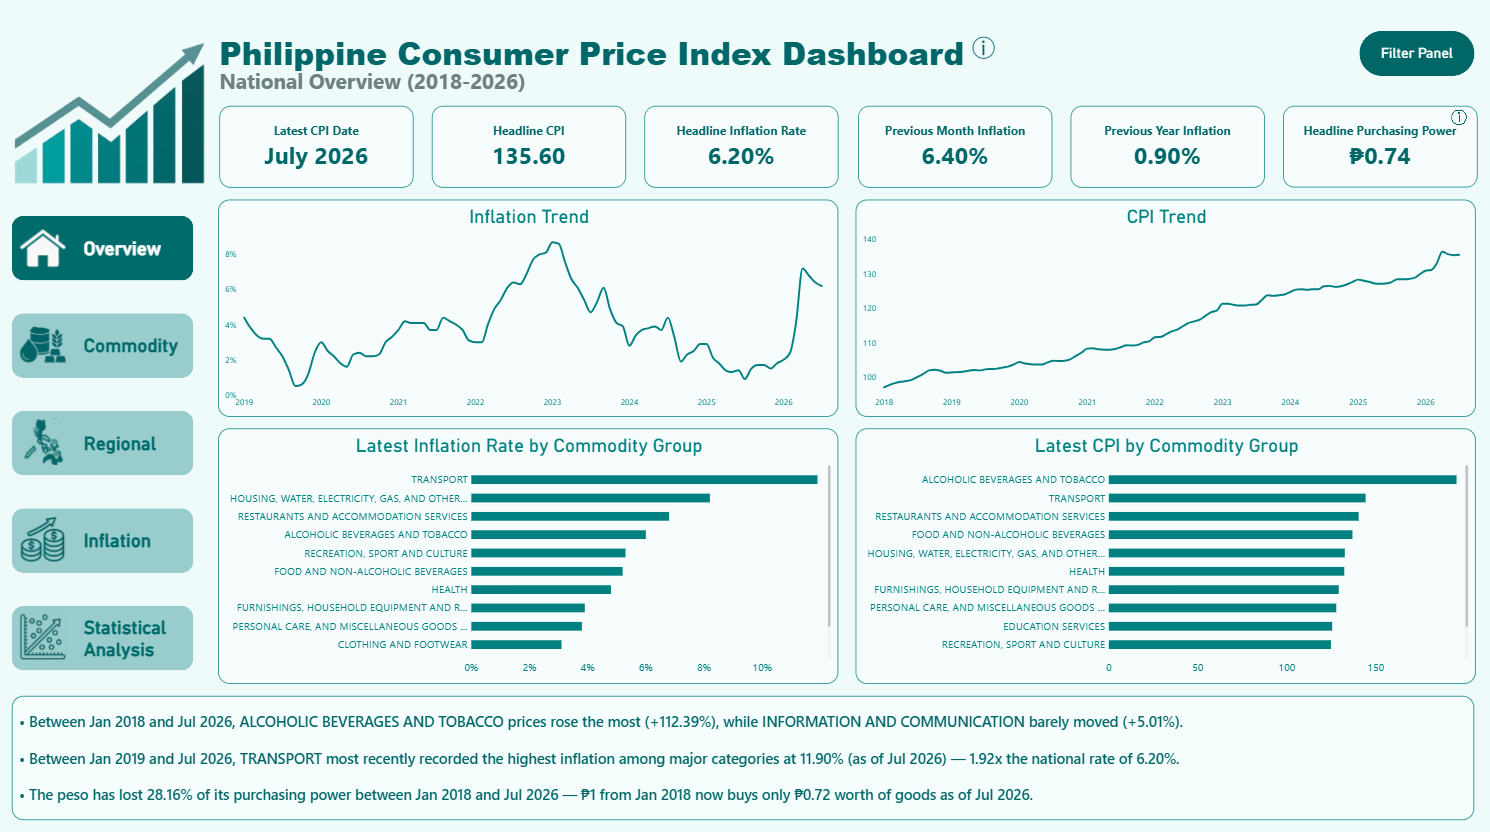
This page presents the national headline story at a glance: the latest CPI value, current inflation rate, and how purchasing power has eroded since the 2018 base year. Three dynamic insight cards automatically surface which commodity has moved the most since 2018, which category currently has the highest inflation rate, and how much value the peso has lost overall — answering the question, "where does the Philippines stand right now, and how did it get there?"

Philippine CPI Dashboard overview page
Overview

Commodity Analysis

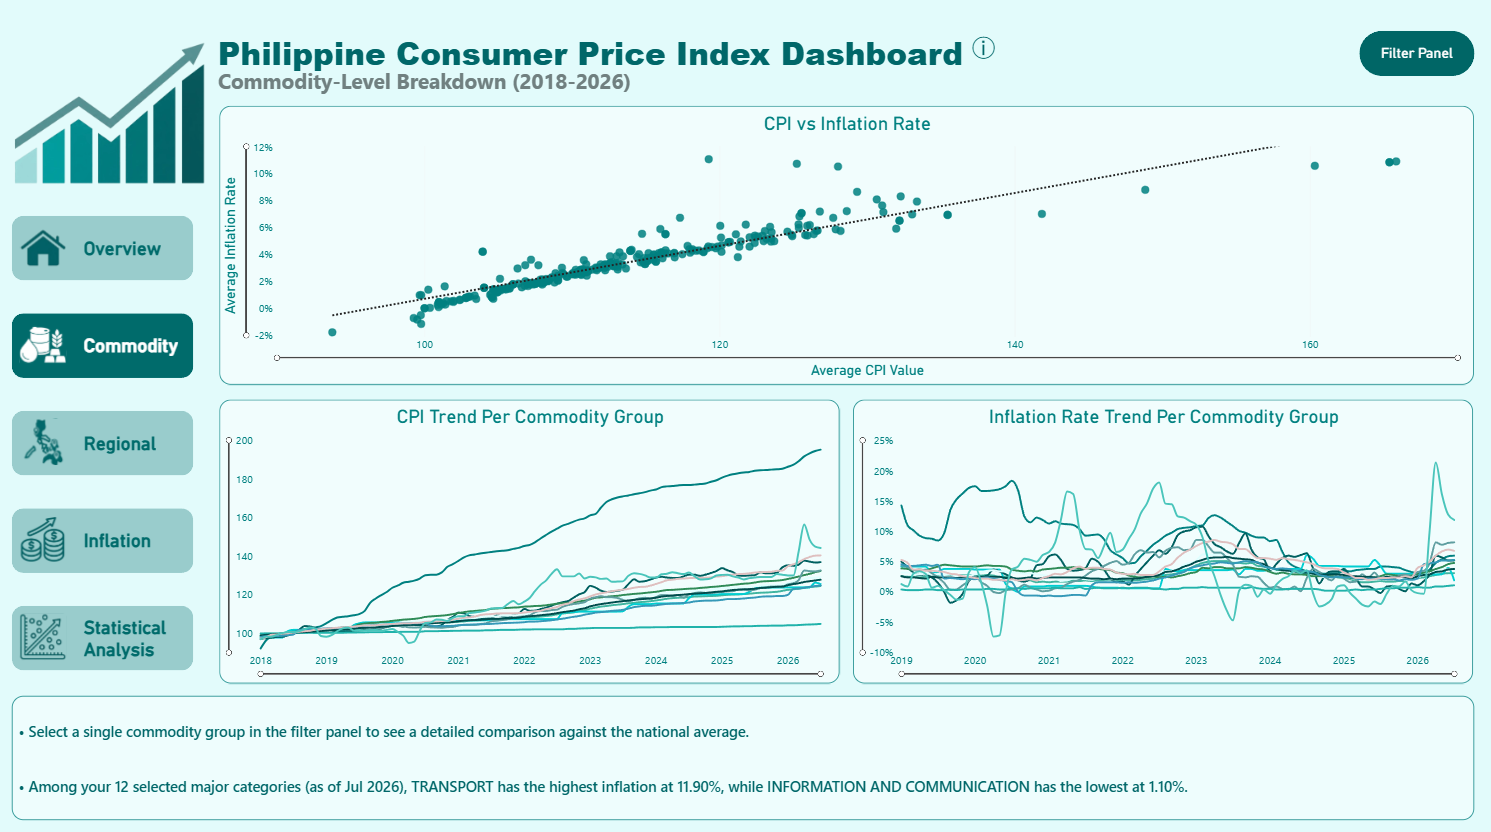
This page lets users explore individual commodity groups in depth, comparing their CPI trends and inflation rates against each other and against the national average. A CPI-vs-Inflation scatter plot reveals which categories combine high price levels with high current inflation, while interactive insight cards respond directly to whichever commodity a user selects — answering "how does this specific category behave, and how does it compare to the rest of the basket?"

Philippine CPI Dashboard commodity analysis page
Commodity Analysis

Regional

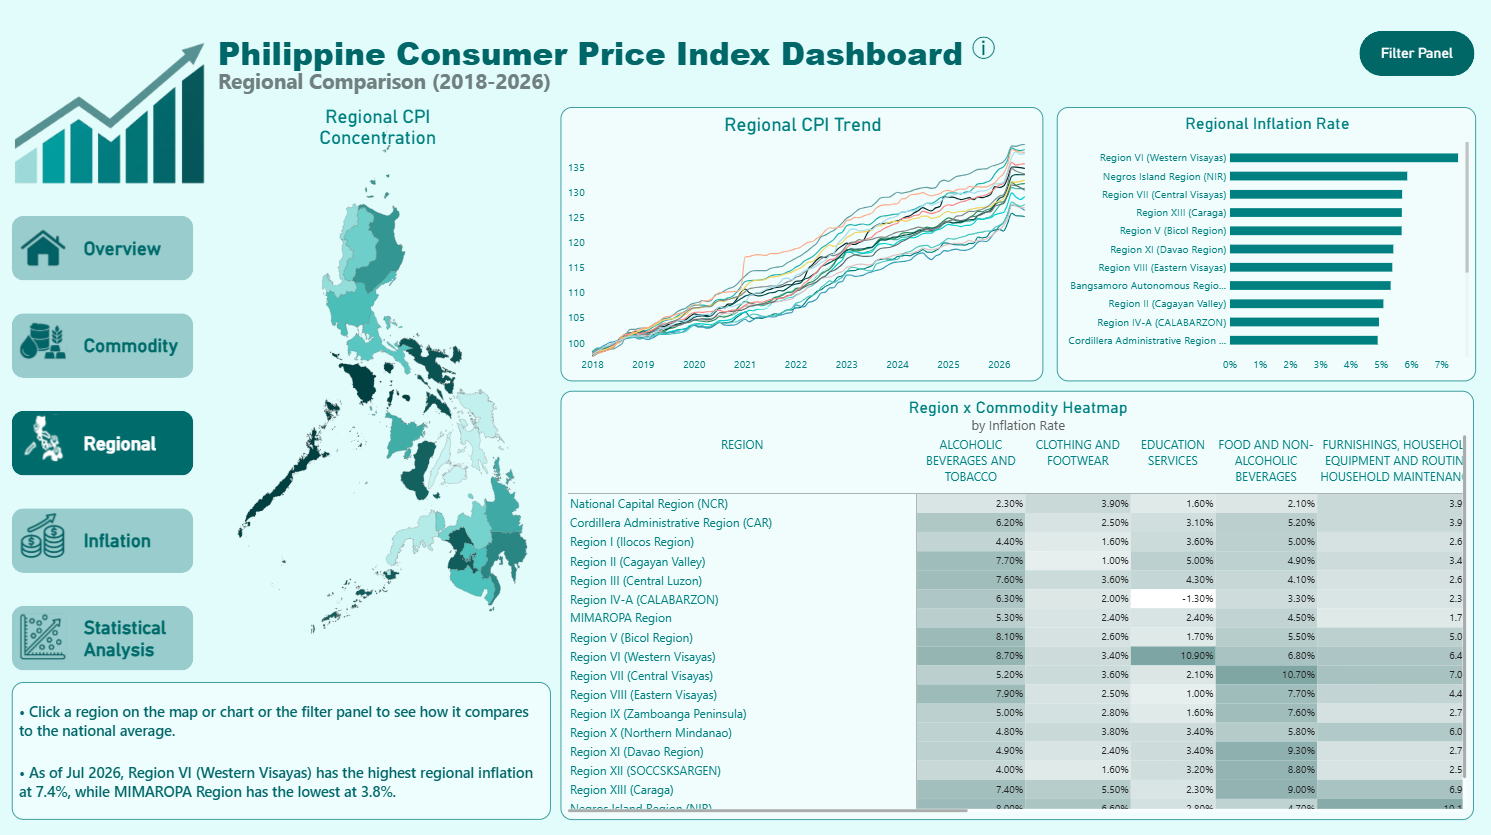
This page compares inflation and CPI across the Philippines' 18 regions through a map, ranking chart, trend lines, and a region-by-commodity heatmap. Clicking any region surfaces its rank and gap from the national average, answering "which parts of the country are experiencing the sharpest price increases, and in which commodity categories?"

Philippine CPI Dashboard regional analysis page
Regional

Inflation Drivers

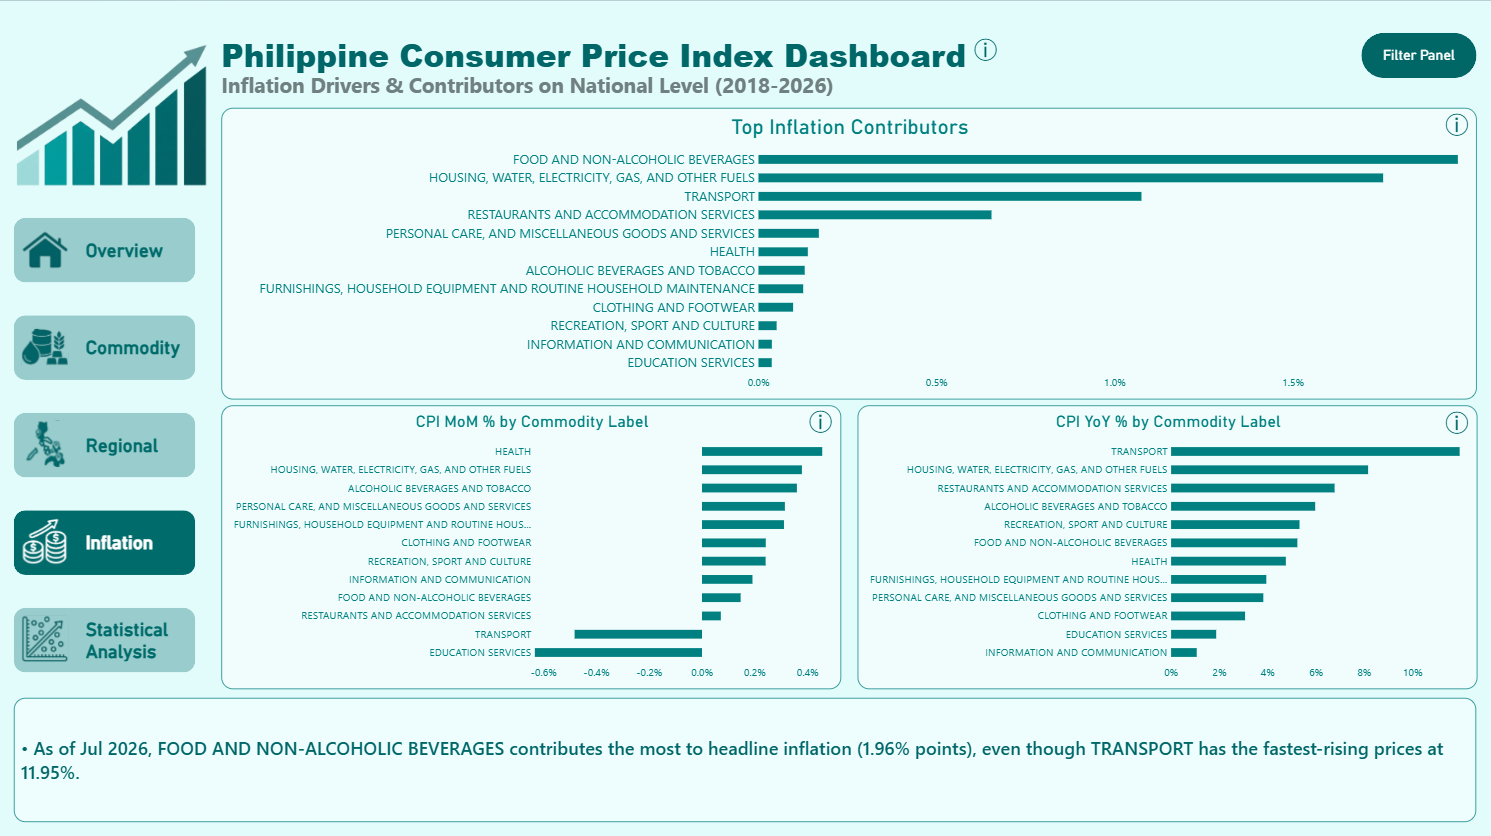
This page moves beyond raw inflation rates to show what's actually driving the headline number, using basket-weighted contribution rather than rate alone. It reveals that a category with a modest inflation rate can still be the biggest overall driver if it makes up a large share of typical spending — answering "what's really responsible for the number everyone sees, once you account for how much people actually buy of each thing?"

Philippine CPI Dashboard inflation drivers page
Inflation Drivers

Statistical Analysis

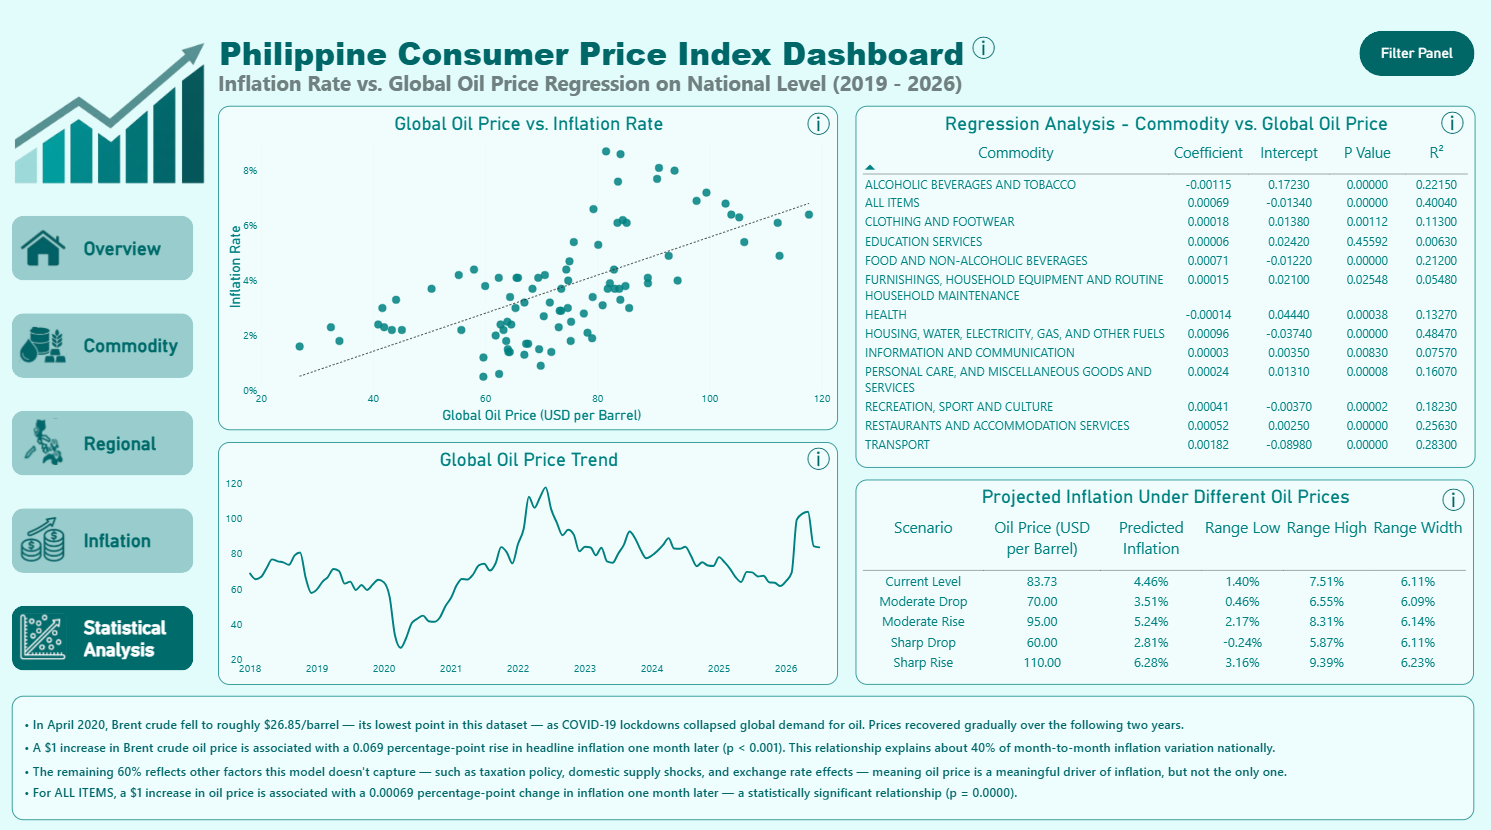
This page tests whether global oil prices can statistically explain Philippine inflation, using a lagged regression model validated against official PSA figures. It quantifies the relationship both nationally and per commodity, reveals a clear transmission pattern from fuel to transport to broader consumer prices, and provides forecast scenarios under different oil price levels — answering "how much of Philippine inflation can be traced back to global oil prices, and what might happen if oil moves in the future?"

Philippine CPI Dashboard statistical analysis page
Statistical Analysis

Methodology

Statistical Approach

The regression analysis on this page uses Ordinary Least Squares (OLS) to test whether global Brent crude oil prices can statistically explain movements in Philippine inflation. Because oil price changes take time to filter through supply chains before reaching consumers, the model uses a one-month lag — comparing this month's inflation against the prior month's oil price — rather than assuming an instantaneous effect. An initial two-predictor model also tested the PHP/USD exchange rate alongside oil price, but the exchange rate showed no statistically significant independent effect (p = 0.232) once oil was included, likely due to the two variables moving together; it was dropped in favor of a cleaner, single-predictor model without meaningfully reducing explanatory power. The final national model was then applied separately to each of the 13 major commodity groups, producing an individual coefficient, p-value, and R² for each — allowing a direct comparison of which categories respond most strongly to oil price changes. To validate the approach, the model's independently-computed year-over-year inflation figures were cross-checked against PSA's own officially published inflation rates and found to closely match, confirming the underlying calculations were methodologically sound before drawing conclusions from the regression results.

Building on the fitted national model, the dashboard also generates forecast scenarios to illustrate how inflation might respond under different oil price conditions. Rather than presenting a single, falsely precise prediction, each scenario includes a 95% prediction interval — the range within which the actual inflation rate could plausibly fall, given the roughly 60% of month-to-month variation the model does not explain (R² = 0.40). This interval is calculated as a genuine prediction interval, not a narrower confidence interval, since the goal is to estimate the plausible range for a single future observation rather than the average long-term relationship. Notably, the width of this interval remains roughly constant (approximately 6 percentage points) across all tested scenarios, indicating that the model's precision does not degrade meaningfully even at more extreme oil price levels within the range of historical data observed.
The build

Tools & Technologies

ToolUsage
Power BI DesktopDashboard design, 5-page report layout, relationships, slicers, and interactivity
DAXKPI measures, YoY/MoM inflation calculations, headline national overrides, dynamic text insights
Power Query (M)Data cleaning, Code/Label splitting, Commodity Level derivation, GeoSortOrder
SQLite (DB Browser)Star schema database — Dim_Date, Dim_Geolocation, Dim_Commodity, Fact tables
ODBCConnected the SQLite database to Power BI Desktop
ExcelInitial data cleaning and encoding correction pass on raw PSA source files
Python (pandas, statsmodels)OLS regression — national and per-commodity oil-inflation models, forecast scenarios
Python (matplotlib)Rendered regression output as visual tables/summaries
VS Code (Jupyter)Independent, reproducible environment for running and documenting the regression analysis
TypeScript / LESS (pbiviz CLI)Built a custom Date Range Slicer visual — mimics the native "Between" slicer with Daily/Monthly/Yearly granularity modes

Reference data

Data Sources

SourceDataLink
Philippine Statistics Authority (PSA)CP22 — Consumer Price Index, CP23 — Inflation Rate, CP24 — Purchasing Power of the Peso, CP25 — Commodity WeightsCP22
CP23
CP24
CP25
FRED (Federal Reserve Economic Data)Global Brent crude oil price (POILBREUSDM)POILBREUSDM

Interactive report

Live Dashboard

Let's make something useful.

Have a dataset, dashboard, or business question that needs a clearer answer?

  • Data analysis and reporting
  • Power BI and Excel dashboards
  • Cleaning, automation, and SQL
Send me an email

Email

bolorenzomiguel@gmail.comm

LinkedIn

www.linkedin.com/in/lorenzobo

Contact number

+63 976 129 8676

Based in

Manila, Philippines