Overview
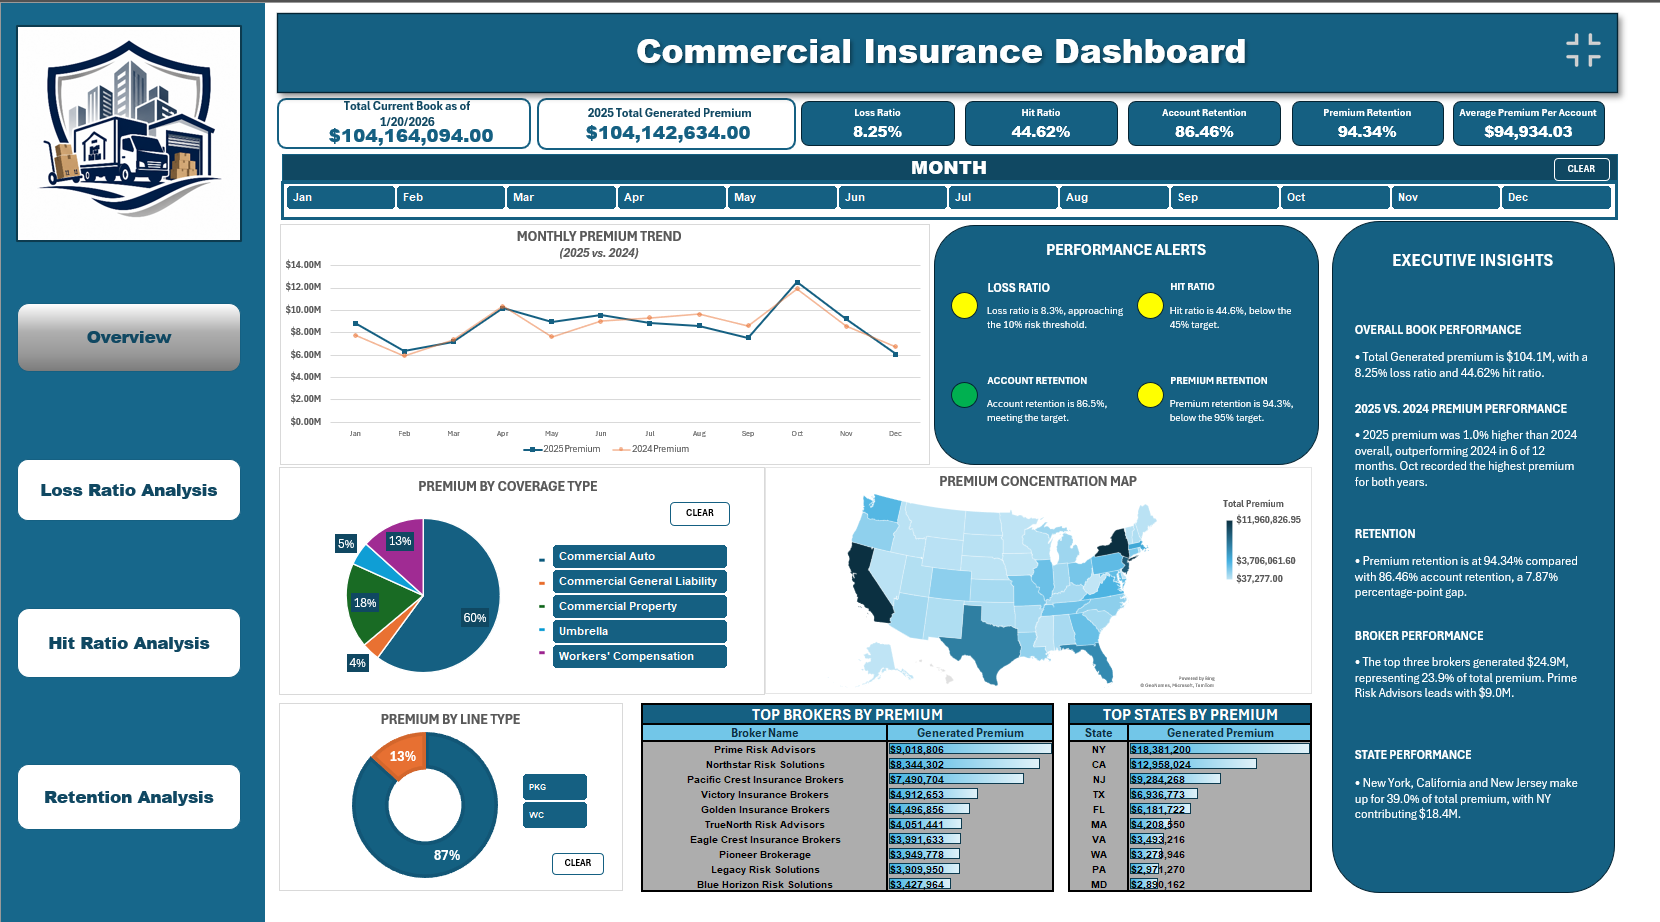
The executive page combines total book summary, monthly premium trend, premium by coverage type and line of business, top brokers and states by premium, performance alert indicators, and an auto-generated executive insights panel.
Excel
An automated, decision-ready view of profitability, competitiveness, and retention built in Excel.
Summary
This dashboard analyzes 2025 commercial insurance performance for a Moving & Storage MGA, with 2024 comparisons where relevant, across Package (PKG) and Workers' Compensation (WC) lines of business. It brings together premium, loss, quote, sold, and renewal data to evaluate portfolio health across roughly 1,000 renewal accounts, 154 brokers, and 48 states.
The four-page report turns Excel into a more practical underwriting tool: automated refresh, alert-driven KPIs, linked navigation, interactive slicers, and filter-aware narrative text help users move from a headline result to the broker, state, coverage type, line of business, or underwriter behind it.
The question
Many MGA and carrier teams rely on Excel as their primary, and often only, business intelligence tool. While modern BI platforms offer more scalable analytics, stakeholders may already know Excel and have established workflows there. This project was built for that reality: it delivers interactive decision support without requiring a new platform.
The result uses PivotTables, Power Query, DAX measures, and VBA automation to address four questions: Is the book performing overall, and where should attention go? Where is the book losing money? How effectively are quotes converting to bound business? Are we keeping the business we have already won?
Inside the dashboard
The executive page combines total book summary, monthly premium trend, premium by coverage type and line of business, top brokers and states by premium, performance alert indicators, and an auto-generated executive insights panel.
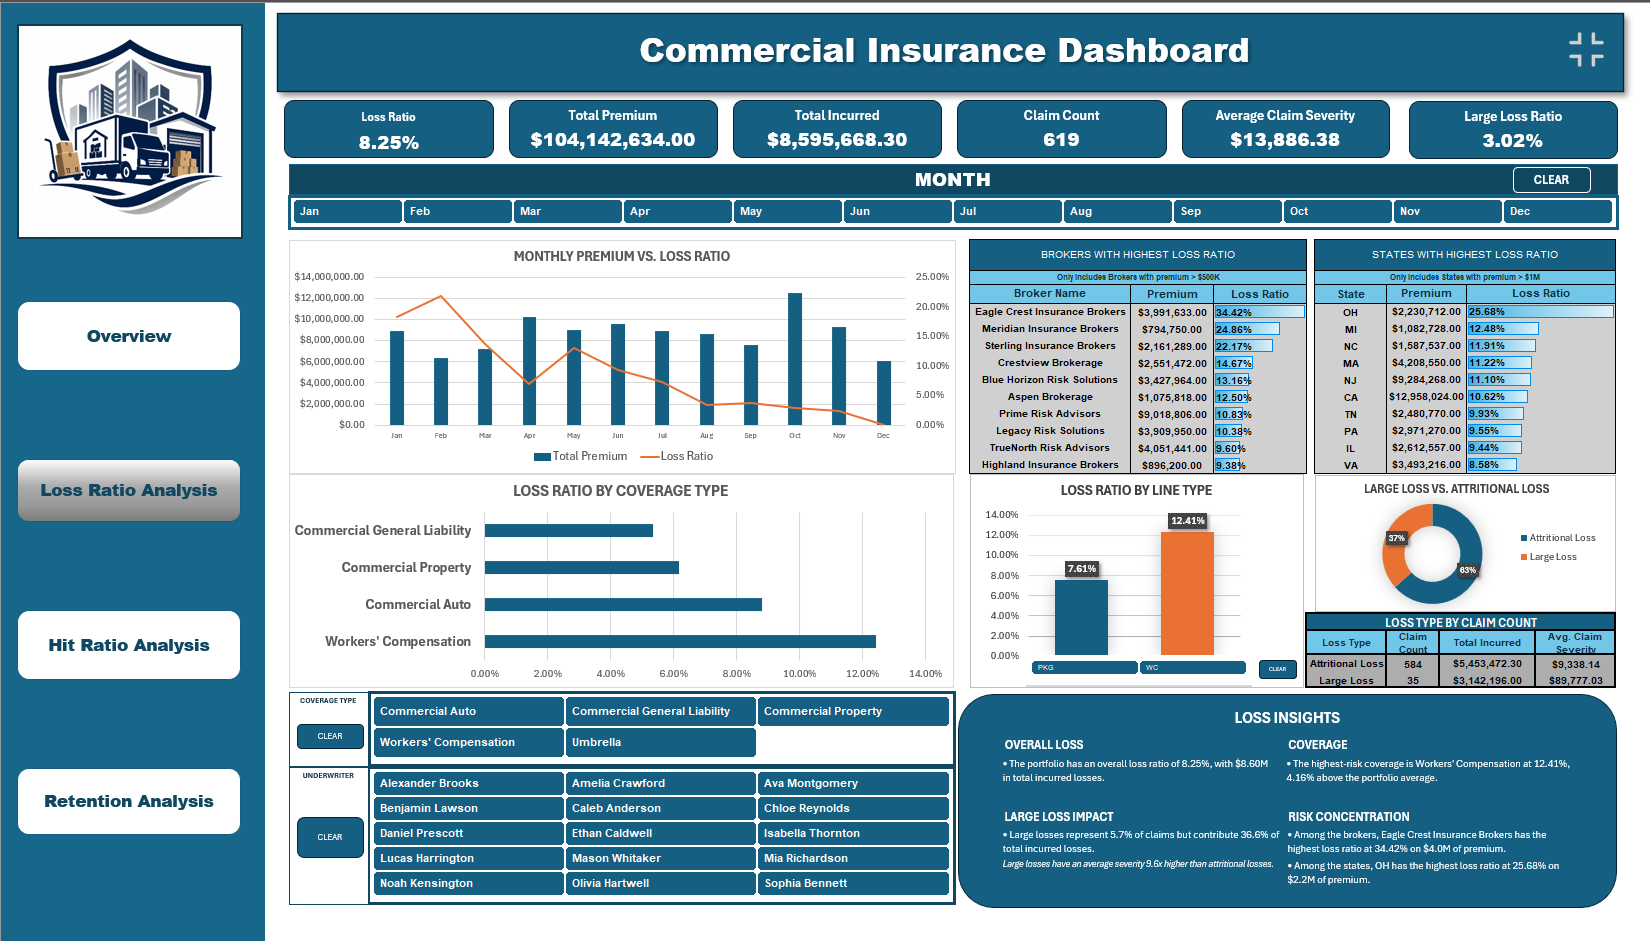
This page shows loss ratio and large loss ratio by month, coverage type, and line of business, alongside broker and state rankings and a claim count and severity breakdown of attritional versus large losses. The comparison helps separate frequency issues from a few large claims.
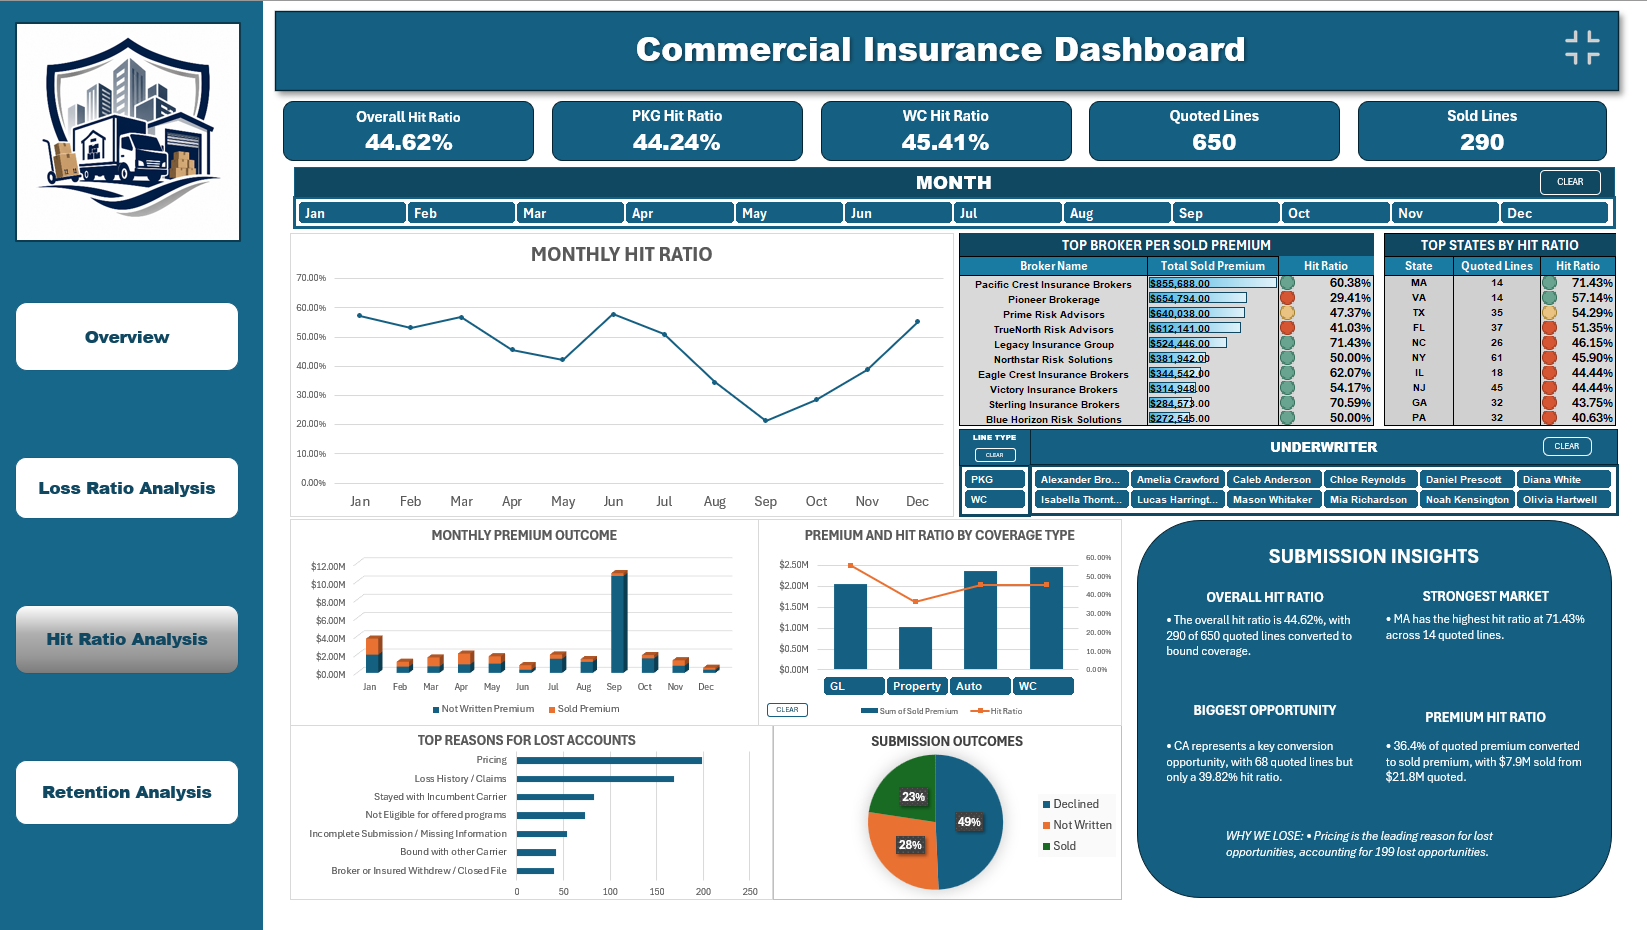
The competitiveness page compares quoted and sold premium and lines, then ranks hit ratio by broker, underwriter, coverage type, and state. Lost-account reasons and the Sold / Quoted, Not Written, and Declined funnel show where opportunities are being won or lost.
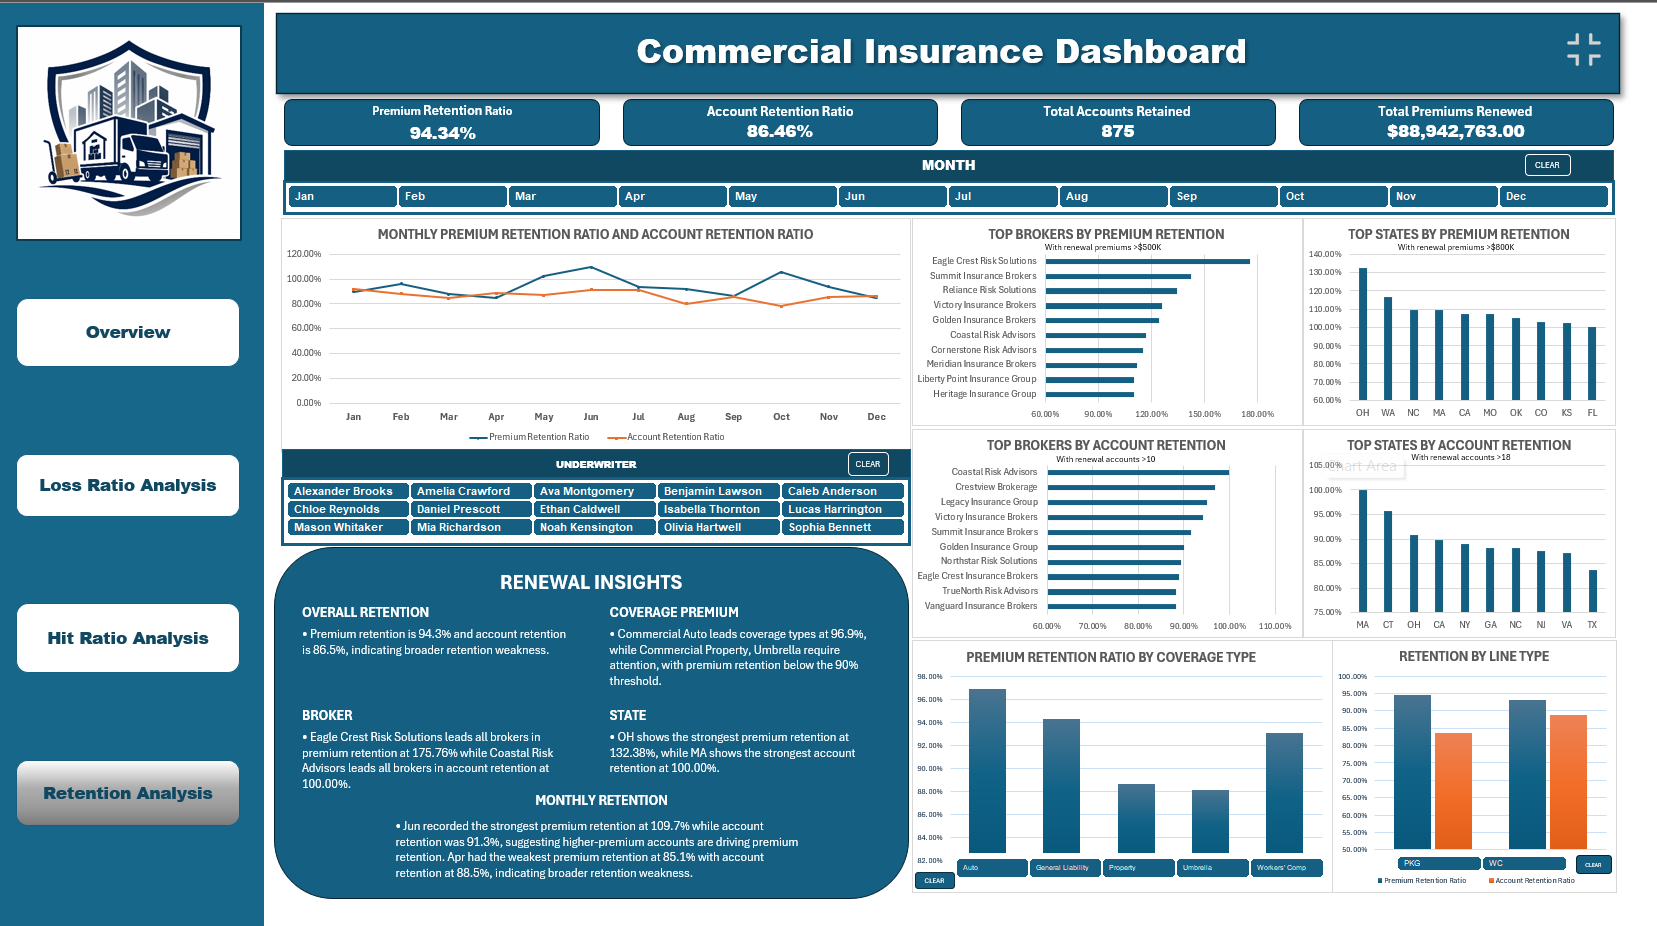
The retention page compares premium and account retention overall and monthly, then breaks results down by broker, state, coverage type, and line of business. Filter-aware narrative insights explain where retention is strongest and where meaningful premium leakage is concentrated.
Methodology
Power Query handles data transformation and cleaning, while Power Pivot and DAX provide the KPI calculations, loss and retention measures, year-over-year comparisons, and alert logic. PivotTables feed the charts, tables, and linked shapes throughout the report.
VBA automation refreshes the dashboard, applies performance alert styling, switches chart views, and generates filter-driven insight text. Slicers connect month, broker, state, coverage type, and underwriter selections across the reporting pages.
The build
| Tool | Usage |
|---|---|
| Excel | Dashboard design, page layout, KPI cards, navigation, and report presentation |
| Power Query | Data transformation, cleaning, and star-schema modeling |
| Power Pivot / DAX | KPI calculations, loss ratio and retention measures, and year-over-year comparisons |
| PivotTables | Underlying data aggregation feeding charts, tables, and linked shapes |
| Native Excel Charts | Trend lines, combo charts, and filter-driven category breakdowns |
| VBA | Dashboard automation, dynamic zoom, performance alert lights, slicer-aware chart switching, and filter-driven insight text |
| Slicers | Cross-page filtering by month, broker, state, coverage type, and underwriter |
| Shape TextLink | Live KPI values linked directly into pivot tooltips |
| SQL | Policy data queried and retrieved from a Microsoft SQL Server database integrated into the agency management system |
| Data Anonymization | Identifying fields replaced with fictional values for portfolio use |
Data disclosure
To protect confidentiality, all personally and operationally identifiable information from the original dataset was anonymized before use. Insured names, underwriter names, broker names, policy IDs, claim IDs, and other identifying fields were replaced with fictional values. Financial and analytical figures, premium, loss, and other monetary amounts were preserved as-is, so the relationships and performance patterns remain consistent with the source structure while protecting sensitive business information.
Download the workbook
Download the portfolio version of the commercial insurance dashboard to explore its worksheets, calculations, interactive slicers, and automated reporting features in Excel.
Download Excel dashboard| Term | Definition | How it's calculated | How to interpret |
|---|---|---|---|
| Generated Premium | Premium from policies successfully bound/written. | Sum of generated/bound premium | Higher generally indicates greater premium production. |
| Quoted | Number of opportunities that received a quote. | Not Written + Sold | Represents the quote volume used in Hit Ratio. |
| Sold | Number of quoted opportunities that were successfully written. | Count of sold opportunities | Used as the numerator of Hit Ratio. |
| Hit Ratio | Percentage of quoted opportunities that were successfully sold. | Sold / Quoted | Higher is generally better. |
| Loss Ratio | Losses relative to generated premium. | Incurred Loss / Generated Premium | Lower generally indicates better underwriting performance. |
| Premium Retention | Percentage of prior-period premium retained. | Retained Premium / Prior Premium | Higher indicates stronger premium retention. |
| Account Retention | Percentage of prior accounts retained. | Retained Accounts / Prior Accounts | Higher indicates stronger customer retention. |
| Large Loss | A loss classified as materially larger than typical attritional losses. | Based on project classification | Highlights losses with disproportionate impact. |
| Attritional Loss | More routine losses that make up the normal loss experience. | Based on project classification | Used as a comparison against large losses. |
| Alert | Performance requiring attention. | Based on KPI thresholds | Indicates performance below the defined acceptable level. |
| Monitor | Performance that warrants observation. | Based on KPI thresholds | Indicates performance between Healthy and Alert. |
| Healthy | Performance within the desired range. | Based on KPI thresholds | Indicates satisfactory performance. |
Have a dataset, dashboard, or business question that needs a clearer answer?